 Anthony McGrath
Home › Data for journalists › Advertising
AdvertisingAlphabet Google advertising revenue by type, 2017 to 2025
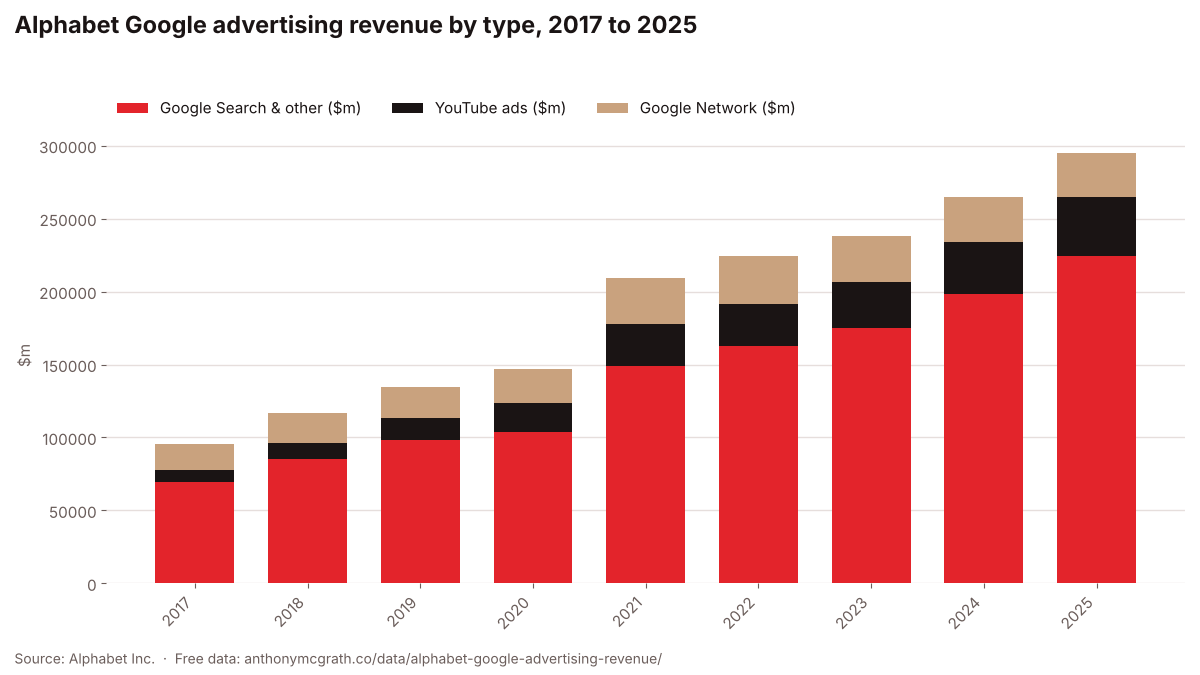
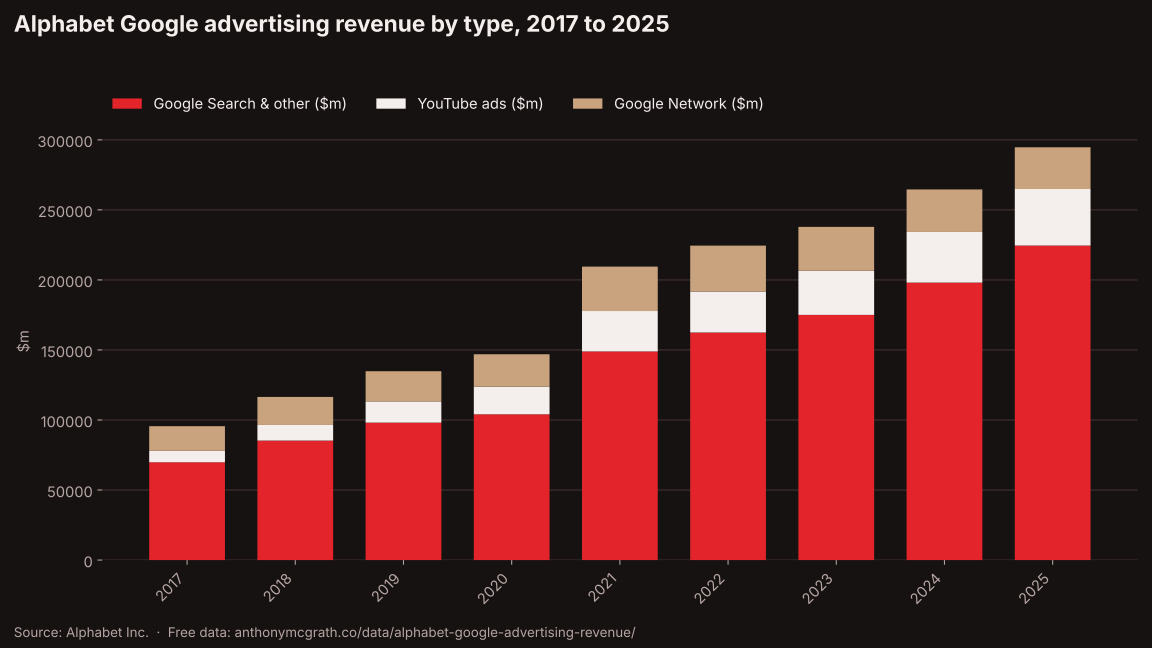
Google's advertising revenue rose from $95.6bn in 2017 to $294.7bn in 2025, with Search and other properties providing roughly three quarters of it every year. YouTube ads have grown almost fivefold while the Google Network business has been shrinking since 2022.
Key findings
- Google Search & other earned $224.5bn in 2025, about 76% of Google's $294.7bn advertising total.
- YouTube ad revenue grew from $8.2bn in 2017 to $40.4bn in 2025, almost five times larger.
- Google Network revenue has fallen three years running, from $32.8bn in 2022 to $29.8bn in 2025.
The data
| Year | Google Search & other ($m) | YouTube ads ($m) | Google Network ($m) |
|---|---|---|---|
| 2017 | 69,811 | 8,150 | 17,616 |
| 2018 | 85,296 | 11,155 | 20,010 |
| 2019 | 98,115 | 15,149 | 21,547 |
| 2020 | 104,062 | 19,772 | 23,090 |
| 2021 | 148,951 | 28,845 | 31,701 |
| 2022 | 162,450 | 29,243 | 32,780 |
| 2023 | 175,033 | 31,510 | 31,312 |
| 2024 | 198,084 | 36,147 | 30,359 |
| 2025 | 224,532 | 40,367 | 29,792 |
Use this data
Free to use in articles, reports and presentations, with credit and a link to this page. Please also credit the original source.
Sources and method
- Alphabet Inc., Form 10-K for fiscal year 2025 (Revenues disaggregated by type, years 2023 to 2025)
- Alphabet Inc., Form 10-K for fiscal year 2022 (Revenues disaggregated by type, years 2020 to 2022)
- Alphabet Inc., Form 10-K for fiscal year 2019 (Google advertising revenues table, years 2017 to 2019)
Annual figures in US$ millions copied from the revenue by type tables in three Alphabet 10-K filings, each covering three fiscal years ending 31 December. Each year is taken from the most recent filing that reports it.
Writing about this?
I have 22 years in Google Ads, Meta, tracking and ecommerce, and I am happy to give an expert comment or explain what the numbers mean for businesses.
Ask for a commentMore on advertising
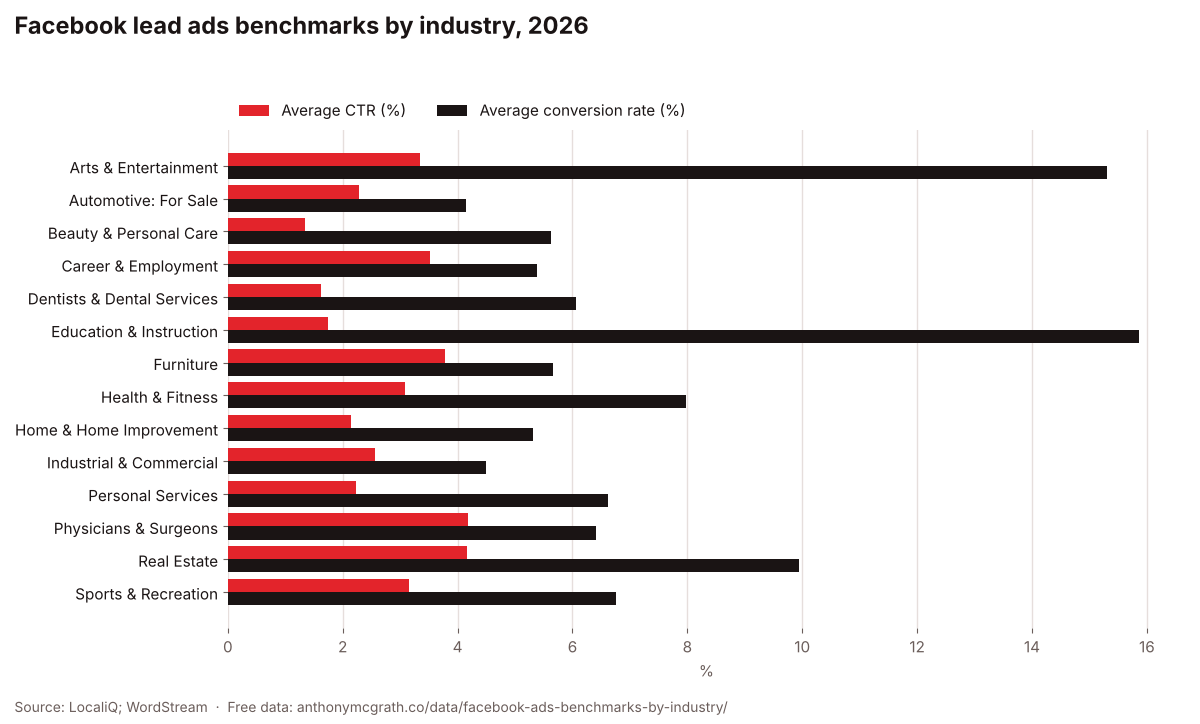
Facebook lead ads benchmarks by industry, 2026
WordStream and LocaliQ's 2026 Facebook ads benchmarks for leads campaigns show an average click-through rate of 2.70%, cost per click of $1.80, conversion rate of 8.54% and cost per lead of $27.39 across industries.
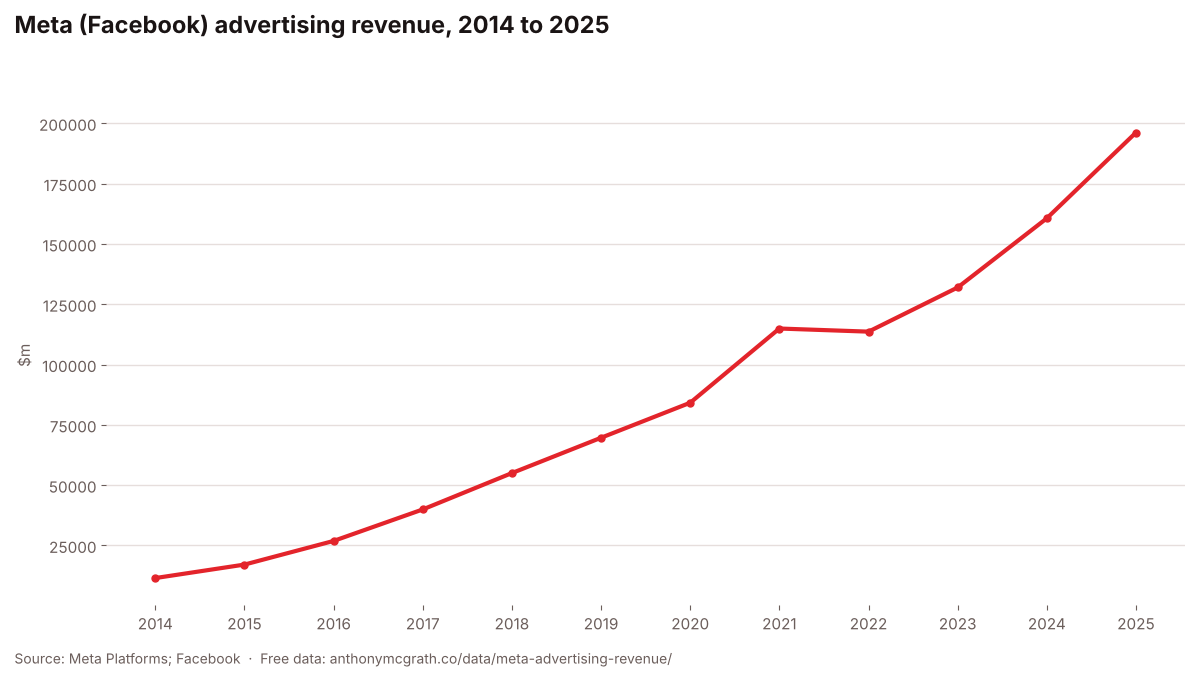
Meta (Facebook) advertising revenue, 2014 to 2025
Meta's advertising revenue grew from $11.5bn in 2014 to $196.2bn in 2025.
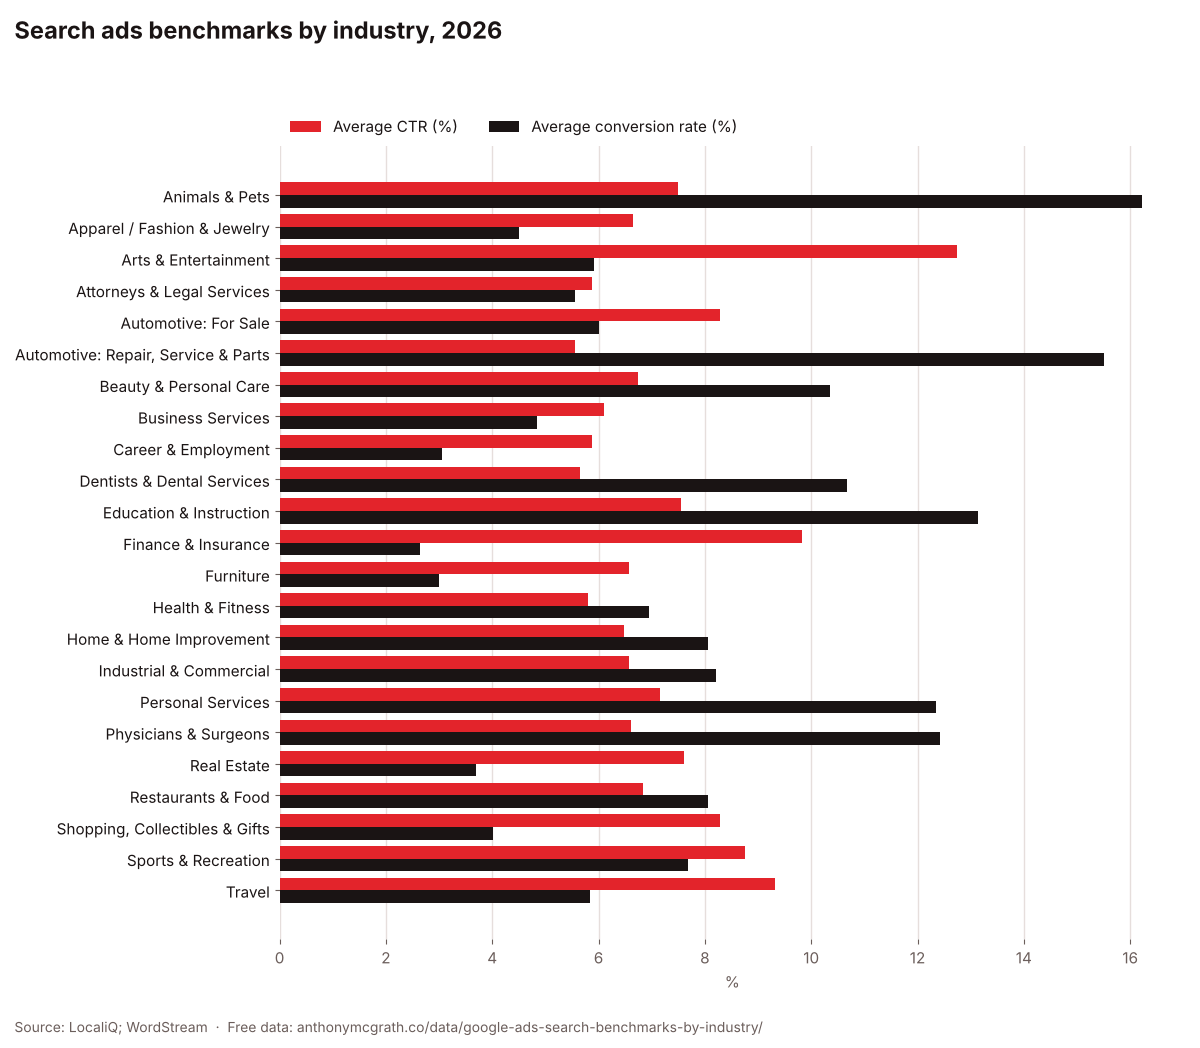
Search ads benchmarks by industry, 2026
WordStream and LocaliQ's 2026 search advertising benchmarks show an average click-through rate of 6.64%, cost per click of $5.42, conversion rate of 8.18% and cost per lead of $66.69 across industries.