 Anthony McGrath
Home › Data for journalists › Advertising
AdvertisingFacebook lead ads benchmarks by industry, 2026
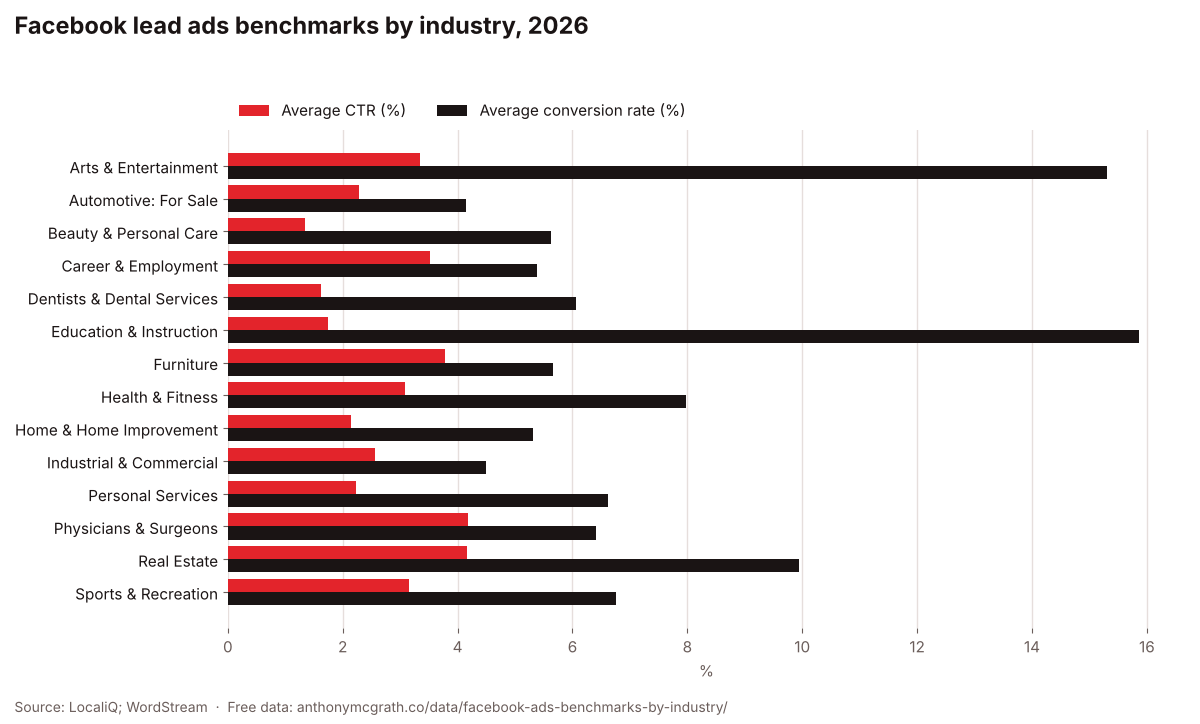
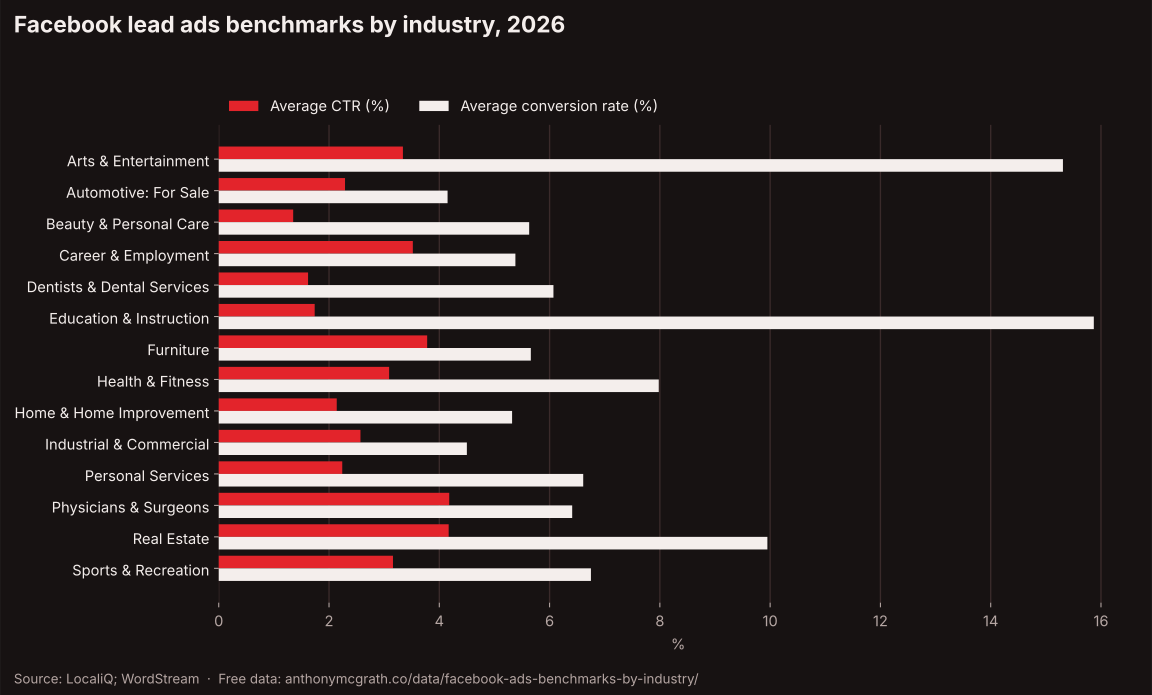
WordStream and LocaliQ's 2026 Facebook ads benchmarks for leads campaigns show an average click-through rate of 2.70%, cost per click of $1.80, conversion rate of 8.54% and cost per lead of $27.39 across industries. Dental practices pay the most for both clicks and leads.
Key findings
- Dentists and dental services have the highest average cost per click ($5.70) and cost per lead ($61.56) for Facebook lead campaigns.
- Career and employment has the lowest cost per lead at $12.30 and the lowest cost per click at $0.73.
- Education and instruction converts best at 15.87%, with arts and entertainment close behind at 15.31%.
The data
| Industry | Average CTR (%) | Average CPC ($) | Average conversion rate (%) | Average cost per lead ($) |
|---|---|---|---|---|
| Arts & Entertainment | 3.34 | 0.88 | 15.31 | 14.59 |
| Automotive: For Sale | 2.29 | 2.01 | 4.15 | 35.52 |
| Beauty & Personal Care | 1.35 | 2.97 | 5.63 | 50.91 |
| Career & Employment | 3.52 | 0.73 | 5.38 | 12.3 |
| Dentists & Dental Services | 1.62 | 5.7 | 6.07 | 61.56 |
| Education & Instruction | 1.74 | 1.72 | 15.87 | 26.31 |
| Furniture | 3.78 | 2.18 | 5.66 | 39.25 |
| Health & Fitness | 3.09 | 1.84 | 7.98 | 27.11 |
| Home & Home Improvement | 2.14 | 2.18 | 5.32 | 42.95 |
| Industrial & Commercial | 2.57 | 1.55 | 4.5 | 35.87 |
| Personal Services | 2.24 | 1.62 | 6.61 | 38.09 |
| Physicians & Surgeons | 4.18 | 1.68 | 6.41 | 32.14 |
| Real Estate | 4.17 | 1.27 | 9.95 | 13.74 |
| Sports & Recreation | 3.16 | 1.08 | 6.75 | 15.49 |
Use this data
Free to use in articles, reports and presentations, with credit and a link to this page. Please also credit the original source.
Sources and method
- LocaliQ, Facebook Advertising Benchmarks for 2026 (with WordStream by LocaliQ) (Leads campaigns tables: average CTR, CPC, CVR and CPL by business category; last updated 23 September 2026)
- WordStream, Facebook Ads Benchmarks (Companion WordStream article for the study (could not be read directly; figures taken from the LocaliQ page))
Industry averages copied from the four leads-objective tables on LocaliQ's 2026 Facebook advertising benchmarks page. Cross-industry averages quoted in the summary are stated in the same article.
Writing about this?
I have 22 years in Google Ads, Meta, tracking and ecommerce, and I am happy to give an expert comment or explain what the numbers mean for businesses.
Ask for a commentMore on advertising
Alphabet Google advertising revenue by type, 2017 to 2025
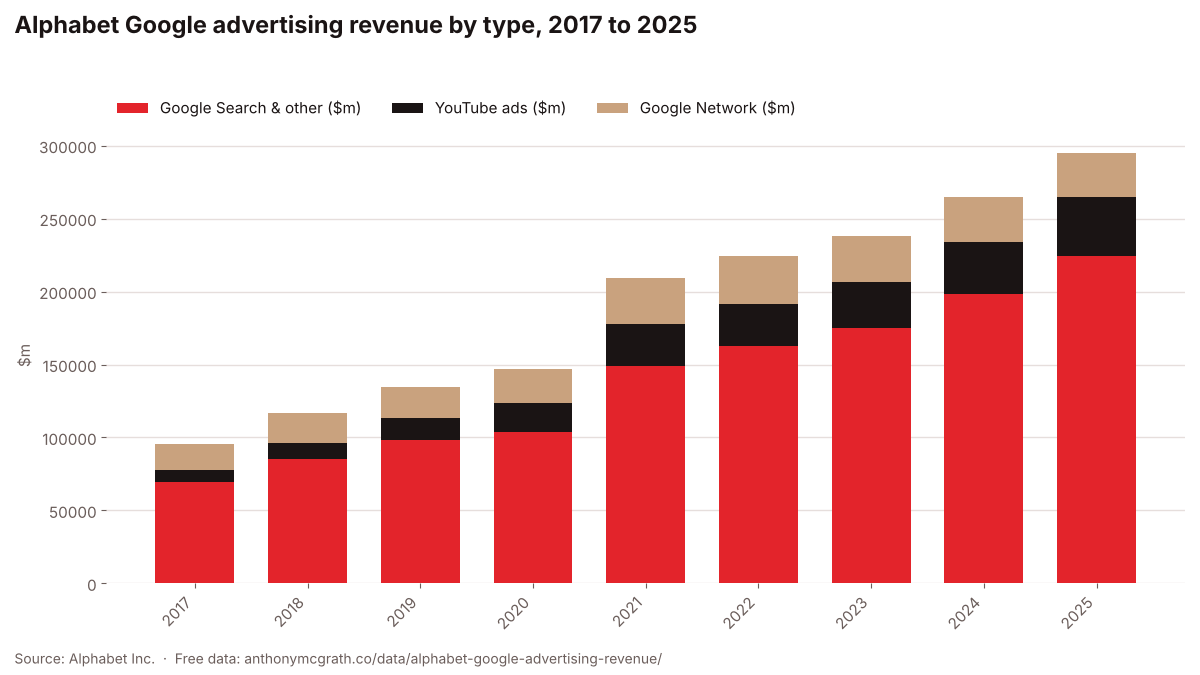
Google's advertising revenue rose from $95.6bn in 2017 to $294.7bn in 2025, with Search and other properties providing roughly three quarters of it every year.
Meta (Facebook) advertising revenue, 2014 to 2025
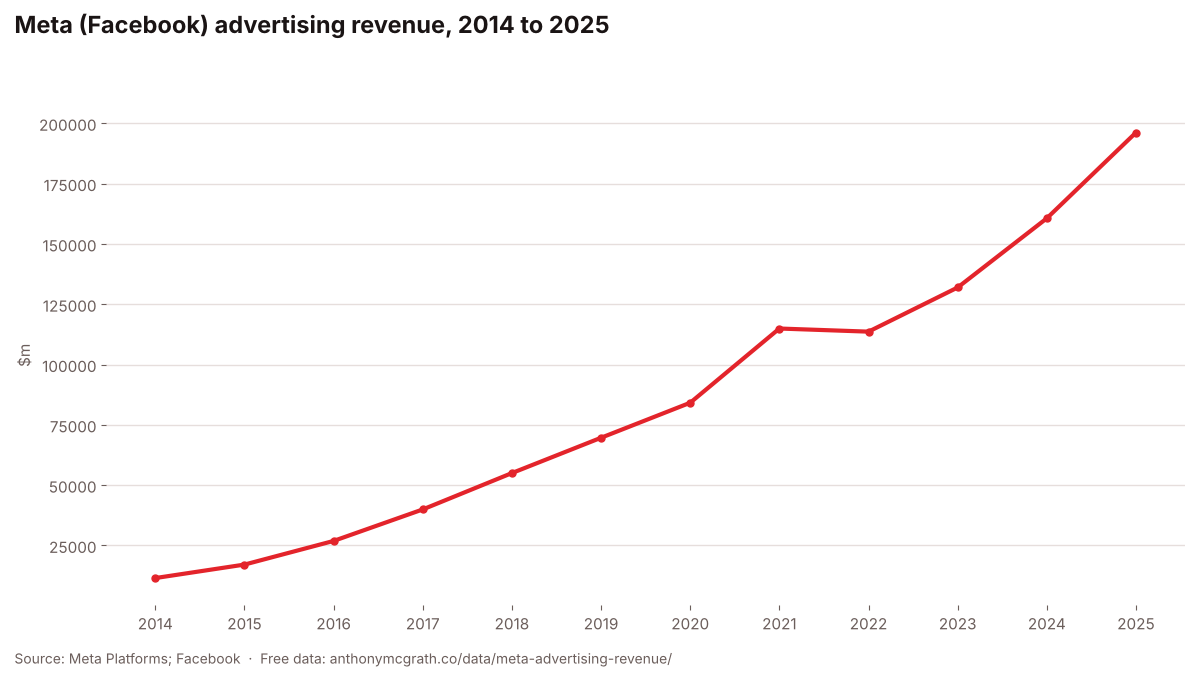
Meta's advertising revenue grew from $11.5bn in 2014 to $196.2bn in 2025.
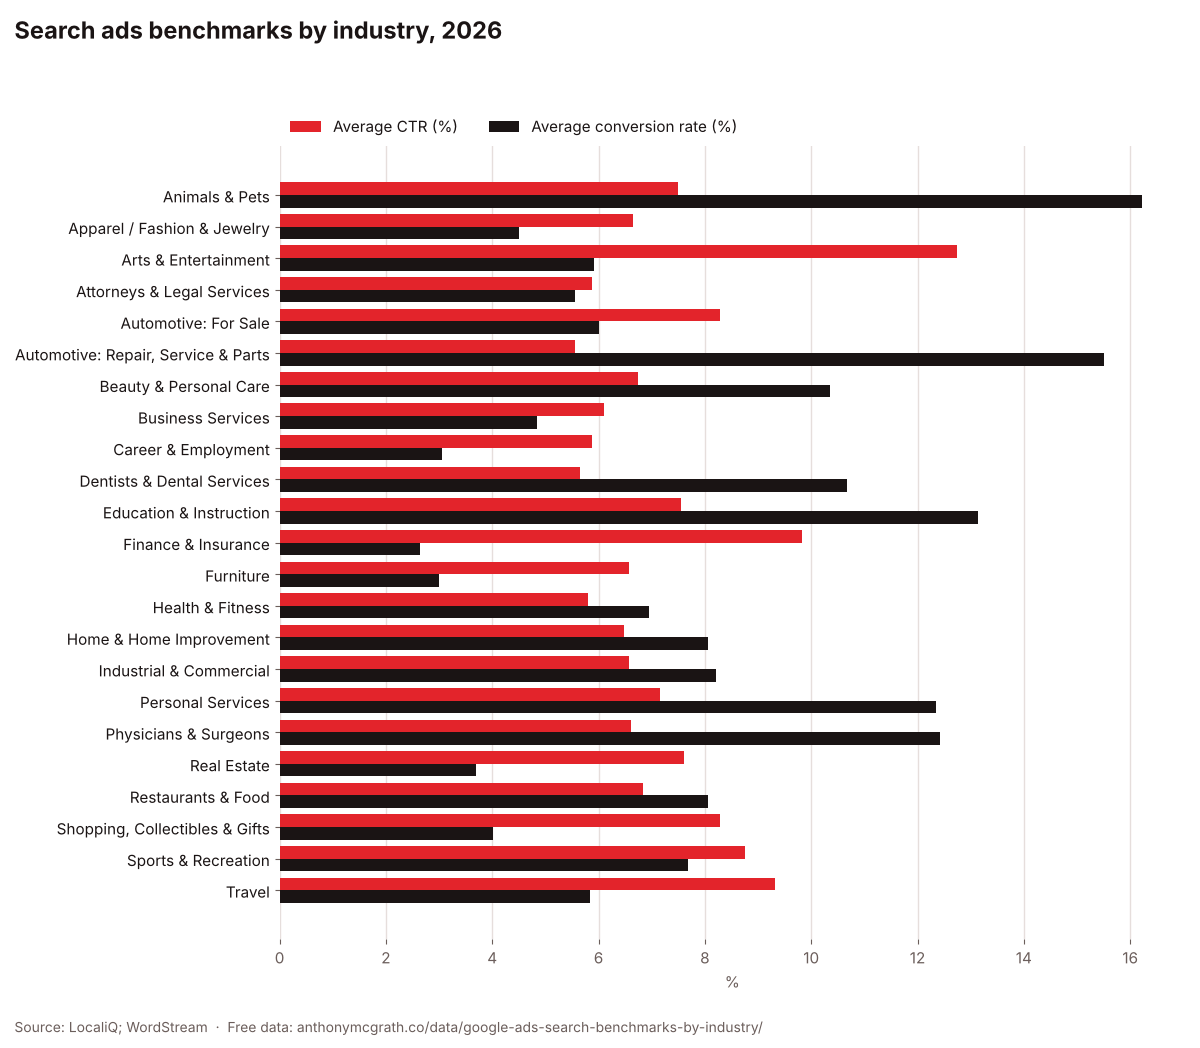
Search ads benchmarks by industry, 2026
WordStream and LocaliQ's 2026 search advertising benchmarks show an average click-through rate of 6.64%, cost per click of $5.42, conversion rate of 8.18% and cost per lead of $66.69 across industries.