 Anthony McGrath
Home › Data for journalists › Advertising
AdvertisingSearch ads benchmarks by industry, 2026
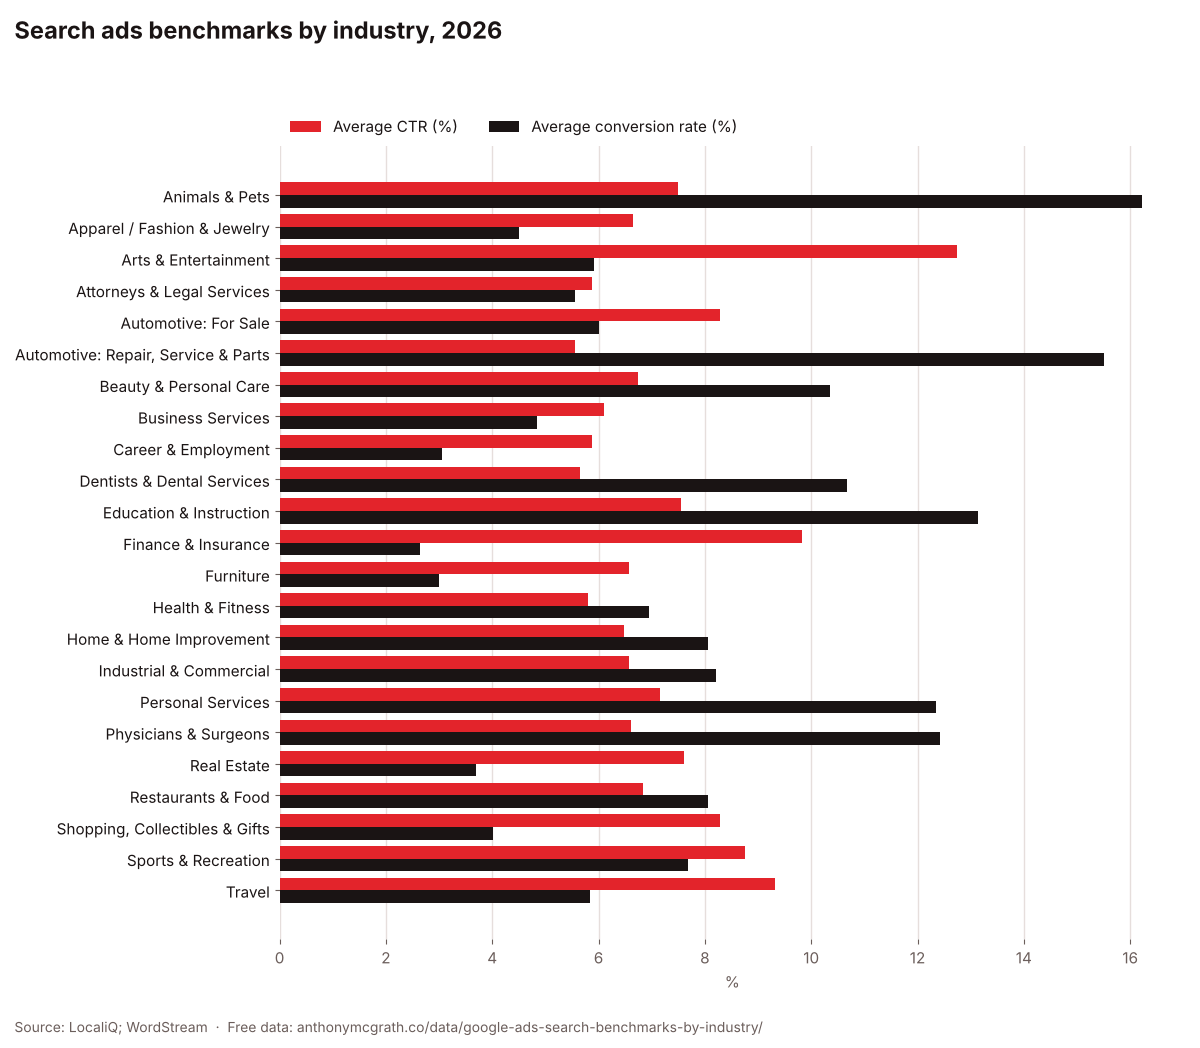
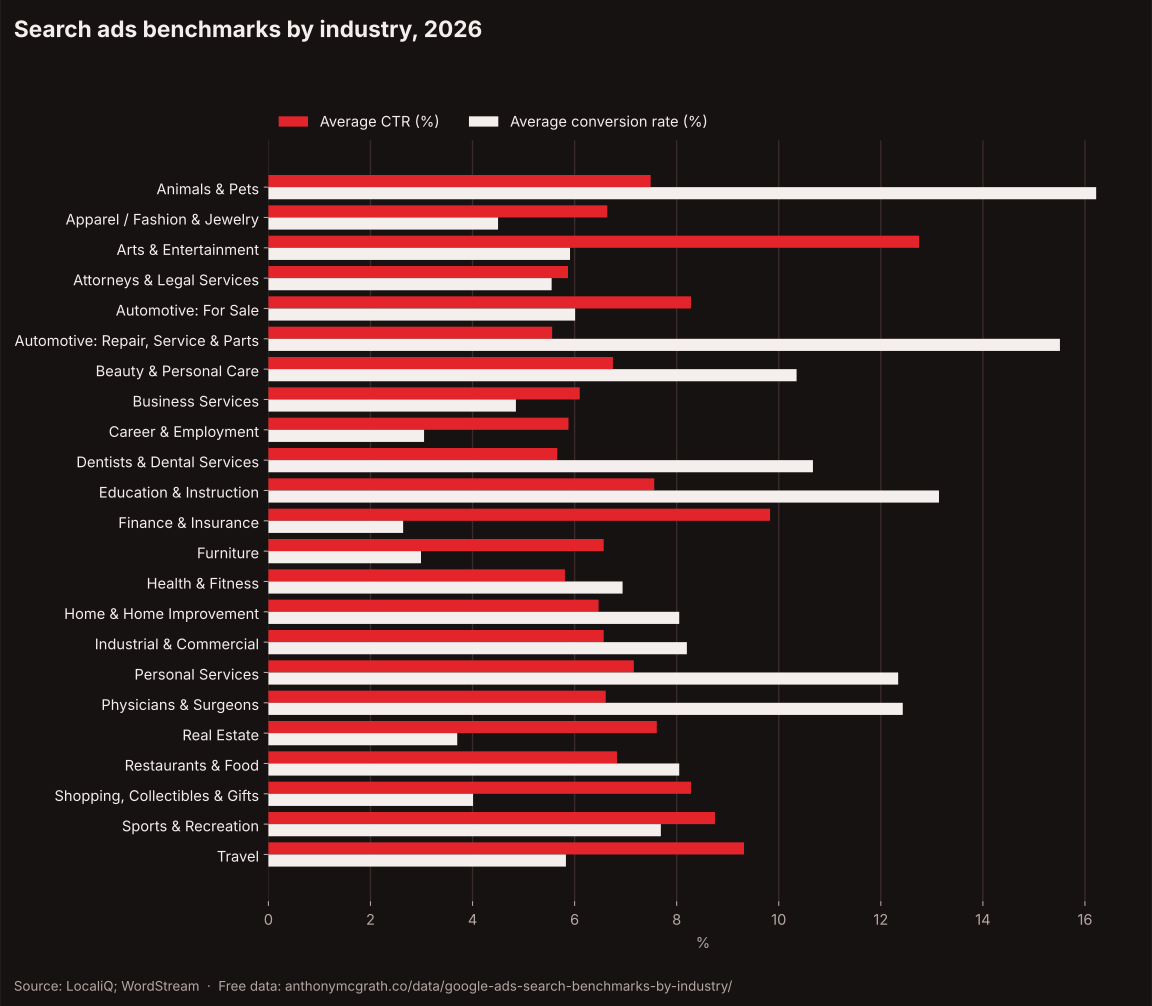
WordStream and LocaliQ's 2026 search advertising benchmarks show an average click-through rate of 6.64%, cost per click of $5.42, conversion rate of 8.18% and cost per lead of $66.69 across industries. Legal services remain the most expensive sector for both clicks and leads.
Key findings
- Attorneys and legal services have the highest average cost per click ($9.87) and cost per lead ($131.63).
- Arts and entertainment has the highest click-through rate at 12.75% and the lowest cost per lead at $26.84.
- Animals and pets has the highest conversion rate at 16.22%, while finance and insurance has the lowest at 2.64%.
The data
| Industry | Average CTR (%) | Average CPC ($) | Average conversion rate (%) | Average cost per lead ($) |
|---|---|---|---|---|
| Animals & Pets | 7.49 | 4.06 | 16.22 | 31.5 |
| Apparel / Fashion & Jewelry | 6.64 | 4.44 | 4.5 | 97.51 |
| Arts & Entertainment | 12.75 | 1.63 | 5.91 | 26.84 |
| Attorneys & Legal Services | 5.87 | 9.87 | 5.55 | 131.63 |
| Automotive: For Sale | 8.28 | 2.27 | 6.01 | 44.26 |
| Automotive: Repair, Service & Parts | 5.56 | 4.35 | 15.51 | 29.96 |
| Beauty & Personal Care | 6.75 | 4.62 | 10.35 | 39.25 |
| Business Services | 6.1 | 5.87 | 4.85 | 93.69 |
| Career & Employment | 5.88 | 5.81 | 3.05 | 67.36 |
| Dentists & Dental Services | 5.66 | 8 | 10.67 | 72.97 |
| Education & Instruction | 7.56 | 4.81 | 13.14 | 77.48 |
| Finance & Insurance | 9.83 | 3.39 | 2.64 | 74.44 |
| Furniture | 6.57 | 3.97 | 2.99 | 106.7 |
| Health & Fitness | 5.81 | 6.17 | 6.94 | 67.36 |
| Home & Home Improvement | 6.47 | 8.33 | 8.05 | 90.92 |
| Industrial & Commercial | 6.57 | 5.87 | 8.2 | 75.19 |
| Personal Services | 7.16 | 7.17 | 12.34 | 54.6 |
| Physicians & Surgeons | 6.61 | 4.76 | 12.43 | 40.04 |
| Real Estate | 7.61 | 3.22 | 3.7 | 102.51 |
| Restaurants & Food | 6.83 | 2.05 | 8.05 | 30.57 |
| Shopping, Collectibles & Gifts | 8.28 | 4.14 | 4.01 | 49.4 |
| Sports & Recreation | 8.75 | 2.77 | 7.69 | 44.26 |
| Travel | 9.32 | 2.14 | 5.83 | 44.7 |
Use this data
Free to use in articles, reports and presentations, with credit and a link to this page. Please also credit the original source.
Sources and method
- LocaliQ, Search Advertising Benchmarks for Every Industry [2026 Data] (with WordStream by LocaliQ) (Tables for average CPC, CTR, CPL and CVR by business category; last updated 1 June 2026)
- WordStream, 2026 Google Ads Benchmarks (Companion WordStream article for the same study (could not be read directly; figures taken from the LocaliQ page))
Industry averages copied from the four by-category tables on LocaliQ's 2026 search advertising benchmarks page. Cross-industry averages quoted in the summary are stated in the same article.
Writing about this?
I have 22 years in Google Ads, Meta, tracking and ecommerce, and I am happy to give an expert comment or explain what the numbers mean for businesses.
Ask for a commentMore on advertising
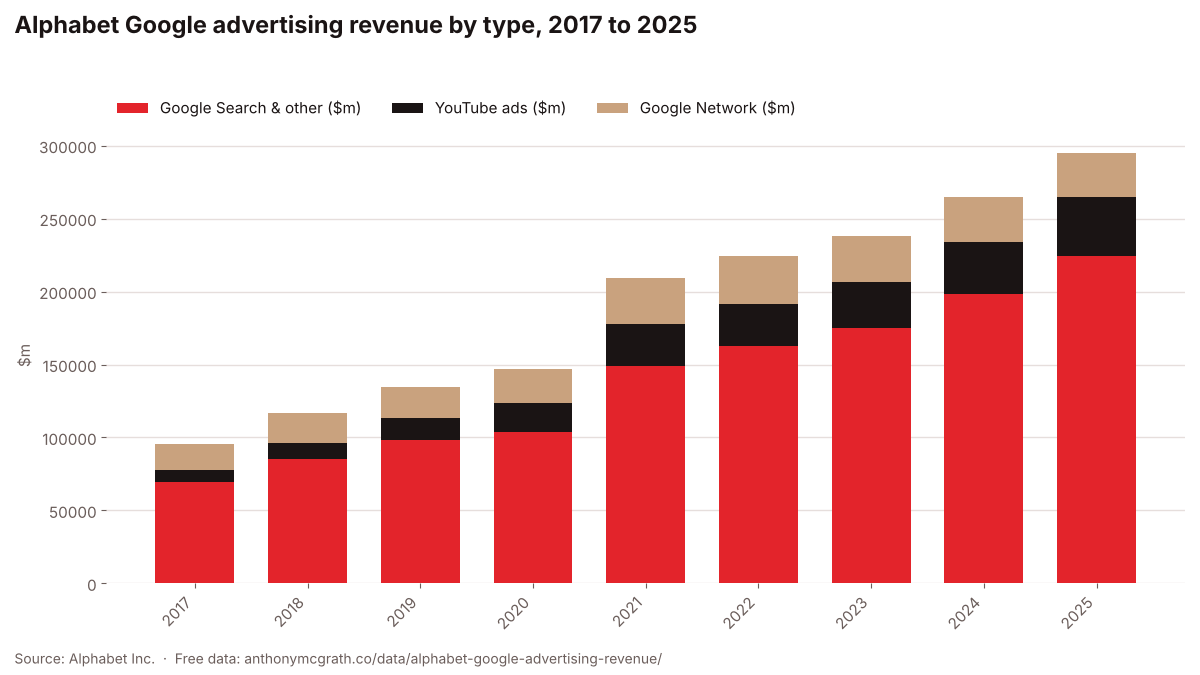
Alphabet Google advertising revenue by type, 2017 to 2025
Google's advertising revenue rose from $95.6bn in 2017 to $294.7bn in 2025, with Search and other properties providing roughly three quarters of it every year.
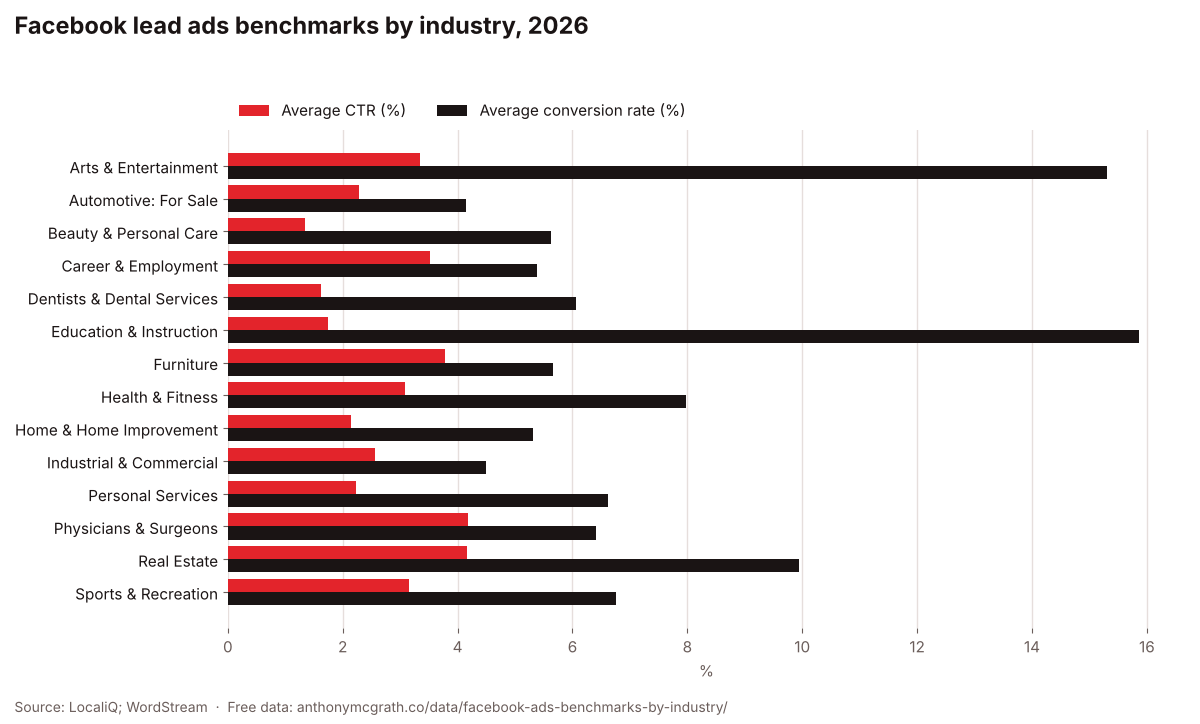
Facebook lead ads benchmarks by industry, 2026
WordStream and LocaliQ's 2026 Facebook ads benchmarks for leads campaigns show an average click-through rate of 2.70%, cost per click of $1.80, conversion rate of 8.54% and cost per lead of $27.39 across industries.
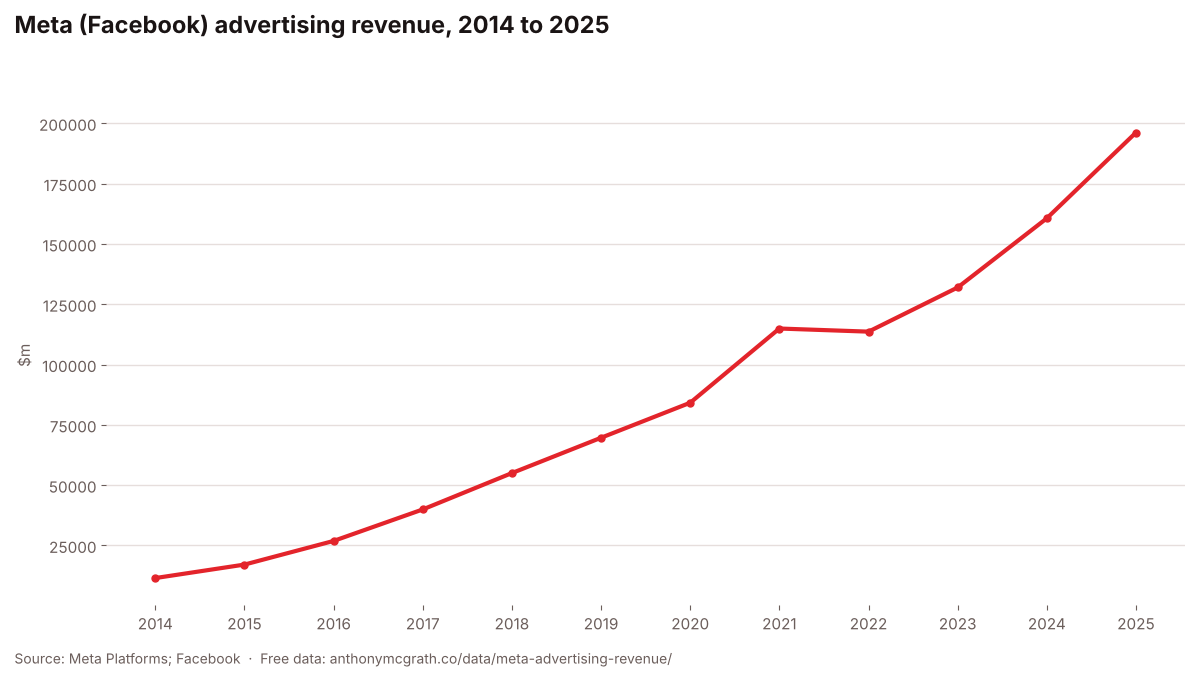
Meta (Facebook) advertising revenue, 2014 to 2025
Meta's advertising revenue grew from $11.5bn in 2014 to $196.2bn in 2025.