 Anthony McGrath
Home › Data for journalists › Ecommerce
EcommerceOnline shopping cart abandonment rates by study, 2015 to 2025
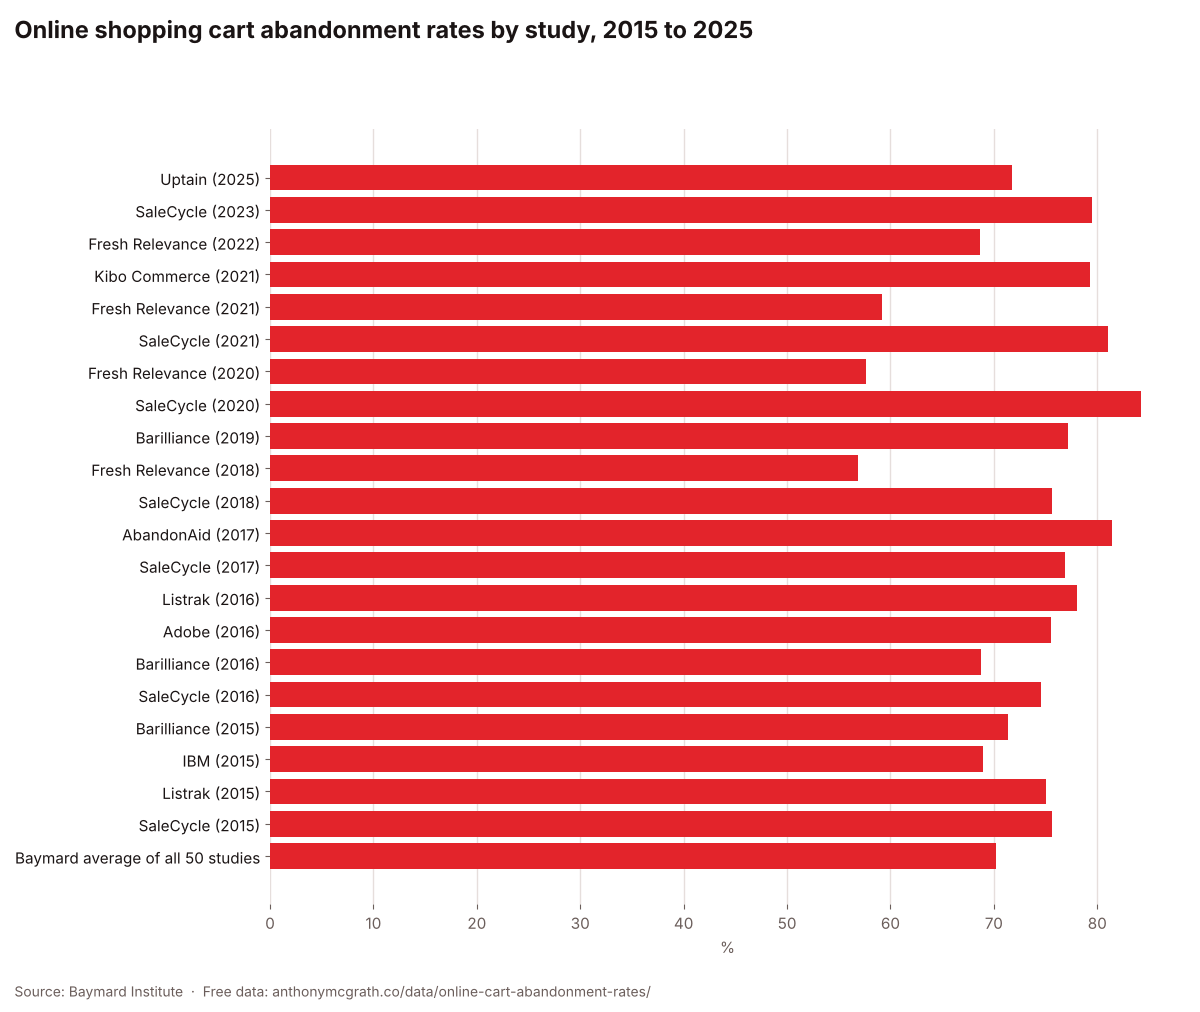
Baymard Institute's running list of 50 cart abandonment studies puts the average documented rate at 70.22%, meaning roughly seven in ten online baskets are left without a purchase. Individual studies since 2015 range from 56.82% to 84.27%.
Key findings
- The average documented cart abandonment rate across 50 studies is 70.22%, according to Baymard Institute.
- The highest rate among studies since 2015 is SaleCycle's 84.27% for 2020; the lowest is Fresh Relevance's 56.82% for 2018.
- The most recent study on the list, Uptain's for 2025, found a 71.72% abandonment rate.
The data
| Study (year) | Cart abandonment rate (%) |
|---|---|
| Uptain (2025) | 71.72 |
| SaleCycle (2023) | 79.53 |
| Fresh Relevance (2022) | 68.7 |
| Kibo Commerce (2021) | 79.3 |
| Fresh Relevance (2021) | 59.22 |
| SaleCycle (2021) | 81.08 |
| Fresh Relevance (2020) | 57.6 |
| SaleCycle (2020) | 84.27 |
| Barilliance (2019) | 77.13 |
| Fresh Relevance (2018) | 56.82 |
| SaleCycle (2018) | 75.6 |
| AbandonAid (2017) | 81.4 |
| SaleCycle (2017) | 76.9 |
| Listrak (2016) | 78 |
| Adobe (2016) | 75.5 |
| Barilliance (2016) | 68.8 |
| SaleCycle (2016) | 74.52 |
| Barilliance (2015) | 71.39 |
| IBM (2015) | 68.95 |
| Listrak (2015) | 75 |
| SaleCycle (2015) | 75.6 |
| Baymard average of all 50 studies | 70.22 |
Use this data
Free to use in articles, reports and presentations, with credit and a link to this page. Please also credit the original source.
Sources and method
- Baymard Institute, Cart Abandonment Rate Statistics (List of 50 studies and average of 70.22%, last updated 22 September 2025 (page fetched 29 October 2026))
All studies on Baymard's list with a study year of 2015 or later are shown, in the order Baymard lists them, plus Baymard's published average across all 50 studies (2006 to 2025).
Writing about this?
I have 22 years in Google Ads, Meta, tracking and ecommerce, and I am happy to give an expert comment or explain what the numbers mean for businesses.
Ask for a commentMore on ecommerce
Amazon advertising services revenue, 2019 to 2025
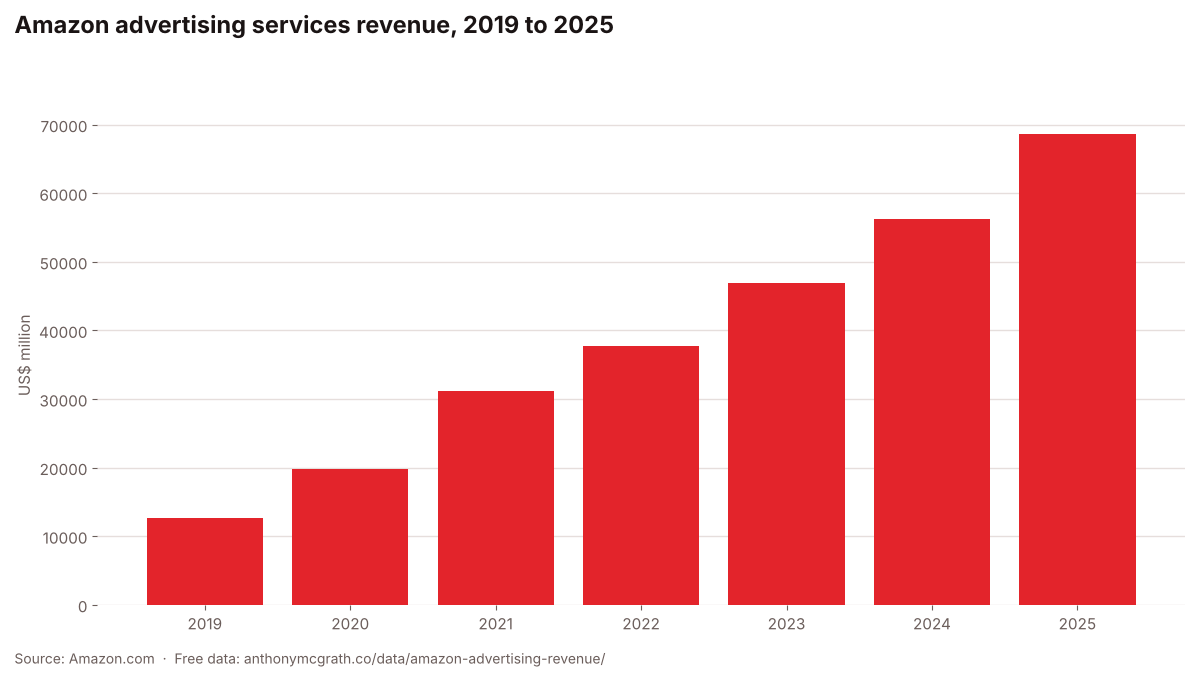
Amazon earned $68.6 billion from advertising services in 2025, more than five times the $12.6 billion it reported for 2019.
Online share of UK retail sales, 2010 to 2025
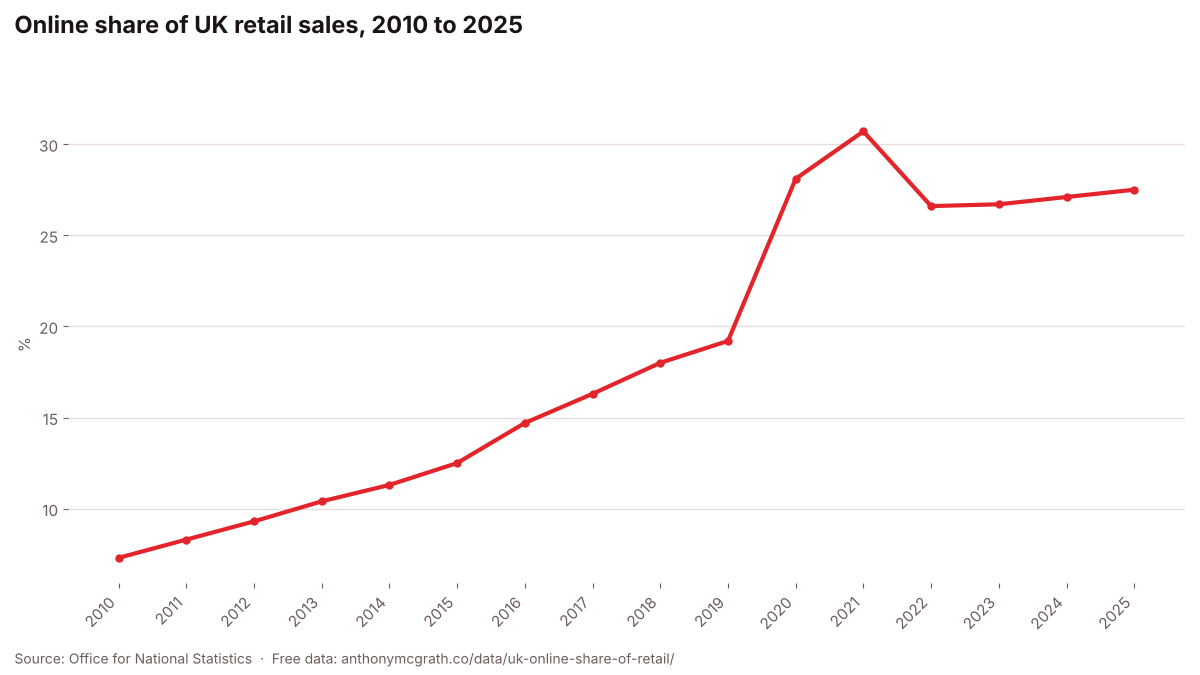
Internet sales made up 7.3% of all retail sales in Great Britain in 2010 and 27.5% in 2025.
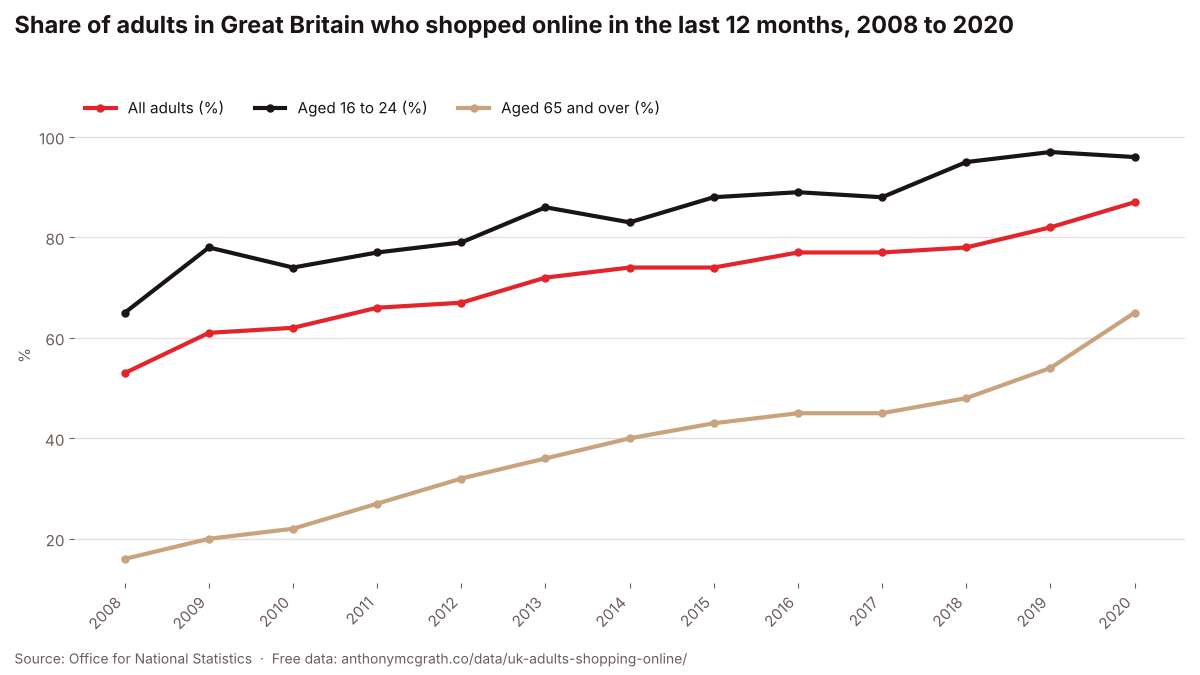
Share of adults in Great Britain who shopped online in the last 12 months, 2008 to 2020
The share of adults in Great Britain who had bought something online in the past year rose from 53% in 2008 to 87% in 2020.