 Anthony McGrath
Home › Data for journalists › Ecommerce
EcommerceShopify gross merchandise volume and revenue, 2015 to 2025
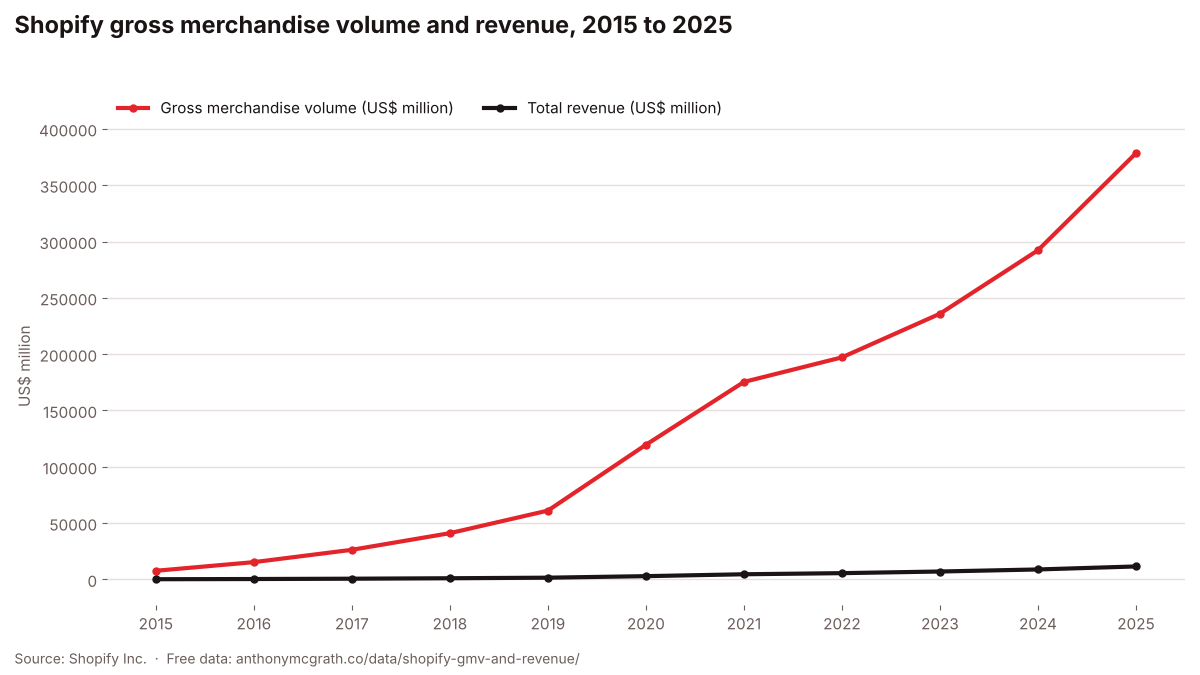
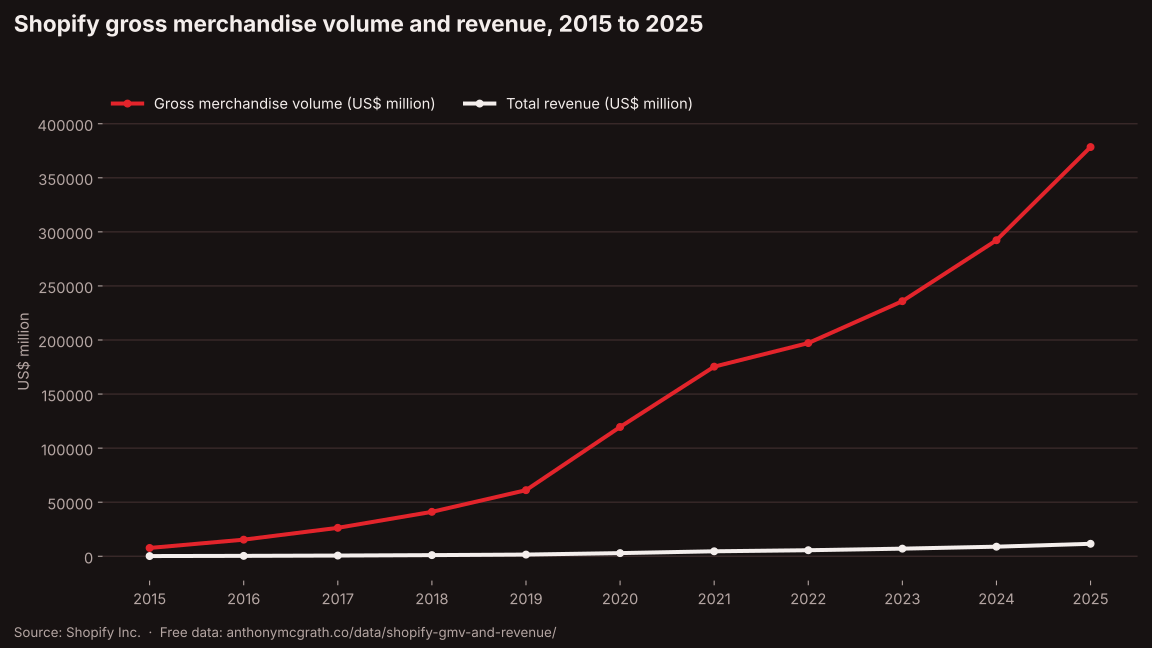
Shopify merchants processed $378.4 billion of orders in 2025, up from $7.7 billion in 2015. Shopify's own revenue grew from $205 million to $11.6 billion over the same decade.
Key findings
- Shopify's GMV rose from $7.7 billion in 2015 to $378.4 billion in 2025, roughly 49 times higher.
- GMV almost doubled in a single year in 2020, from $61.1 billion in 2019 to $119.6 billion.
- Shopify revenue passed $10 billion for the first time in 2025, at $11,556 million, up from $8,880 million in 2024.
The data
| Year | Gross merchandise volume (US$ million) | Total revenue (US$ million) |
|---|---|---|
| 2015 | 7,706.66 | 205.23 |
| 2016 | 15,374.17 | 389.33 |
| 2017 | 26,320.15 | 673.3 |
| 2018 | 41,103.24 | 1,073.23 |
| 2019 | 61,138.46 | 1,578.17 |
| 2020 | 119,577.15 | 2,929.49 |
| 2021 | 175,361.81 | 4,611.86 |
| 2022 | 197,166.88 | 5,599.86 |
| 2023 | 235,910 | 7,060 |
| 2024 | 292,275 | 8,880 |
| 2025 | 378,441 | 11,556 |
Use this data
Free to use in articles, reports and presentations, with credit and a link to this page. Please also credit the original source.
Sources and method
- Shopify Inc., Form 10-K for 2025 (SEC) (Key performance indicators table (GMV 2023 to 2025) and revenue table (2023 to 2025), in US$ millions)
- Shopify Inc., MD&A for 2022, Form 40-F exhibit 99.3 (SEC) (GMV 2021 and 2022; revenue 2020 to 2022, in US$ thousands)
- Shopify Inc., MD&A for 2020, Form 40-F exhibit (SEC) (GMV 2019 and 2020; revenue 2019, in US$ thousands)
- Shopify Inc., MD&A for 2018, Form 40-F exhibit (SEC) (GMV 2017 and 2018; revenue 2017 and 2018, in US$ thousands)
- Shopify Inc., MD&A for 2016, Form 40-F exhibit (SEC) (GMV 2015 and 2016; revenue 2015 and 2016, in US$ thousands)
GMV and total revenue taken from Shopify's annual filings with the SEC, using the most recent filing that reports each year. Values reported in US$ thousands (2015 to 2022) were divided by 1,000 to give US$ millions, with no rounding; 2023 to 2025 are as reported in millions.
Writing about this?
I have 22 years in Google Ads, Meta, tracking and ecommerce, and I am happy to give an expert comment or explain what the numbers mean for businesses.
Ask for a commentMore on ecommerce
Amazon advertising services revenue, 2019 to 2025
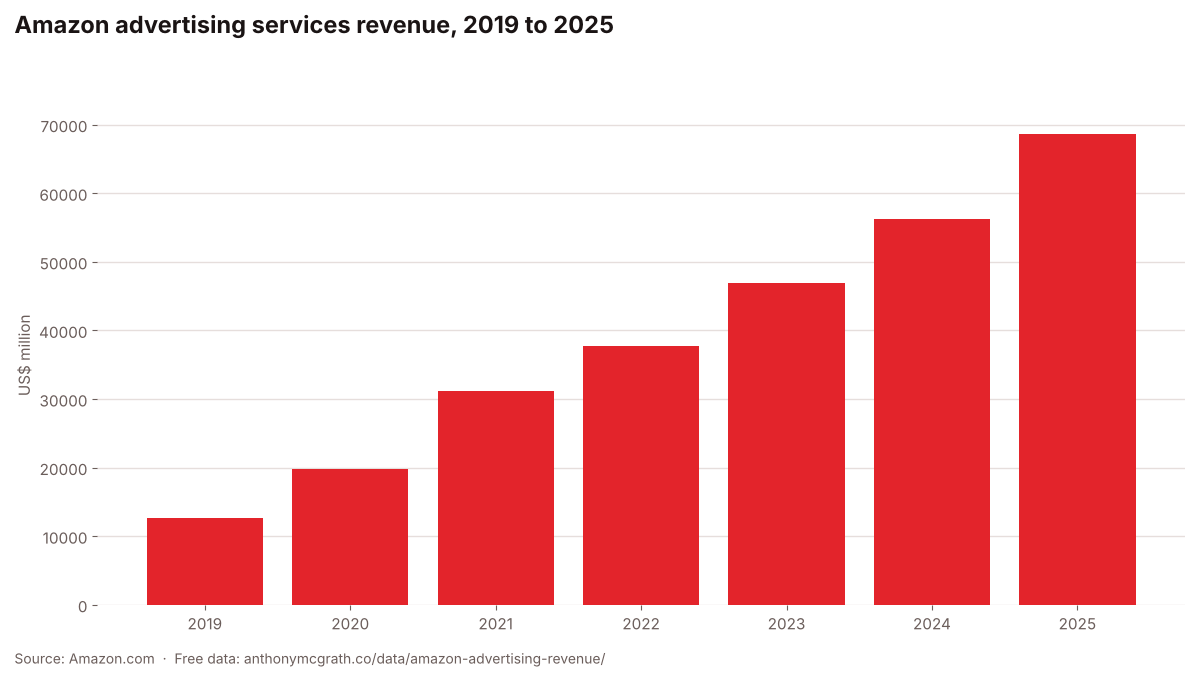
Amazon earned $68.6 billion from advertising services in 2025, more than five times the $12.6 billion it reported for 2019.
Online share of UK retail sales, 2010 to 2025
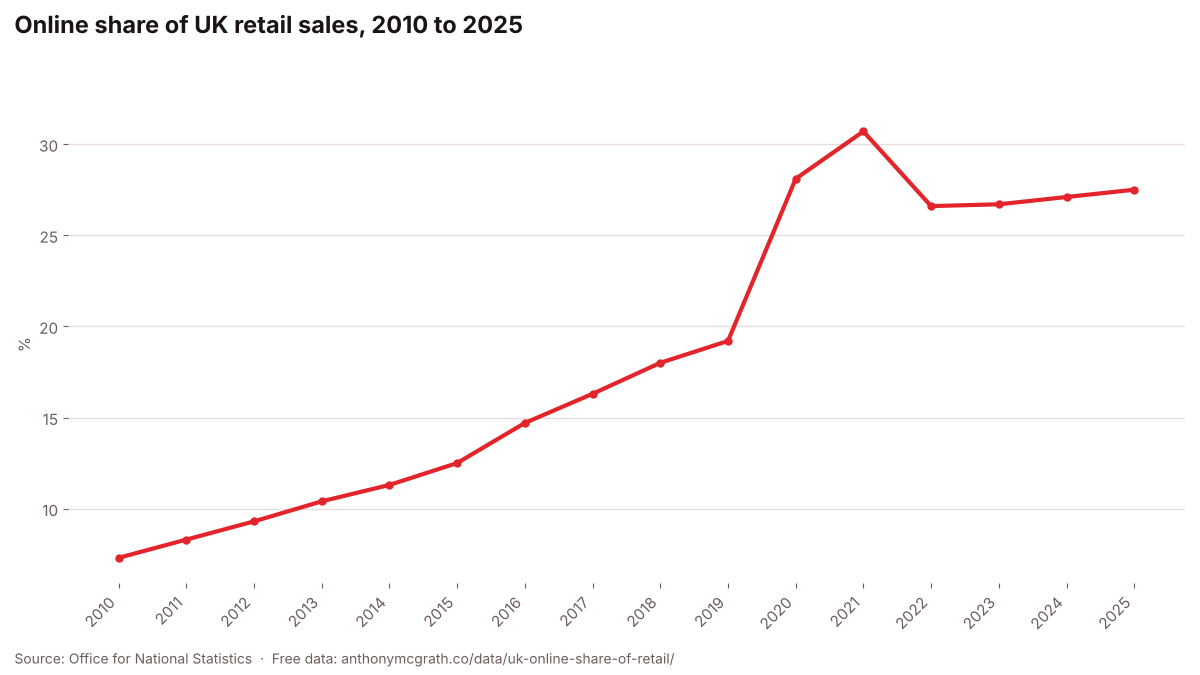
Internet sales made up 7.3% of all retail sales in Great Britain in 2010 and 27.5% in 2025.
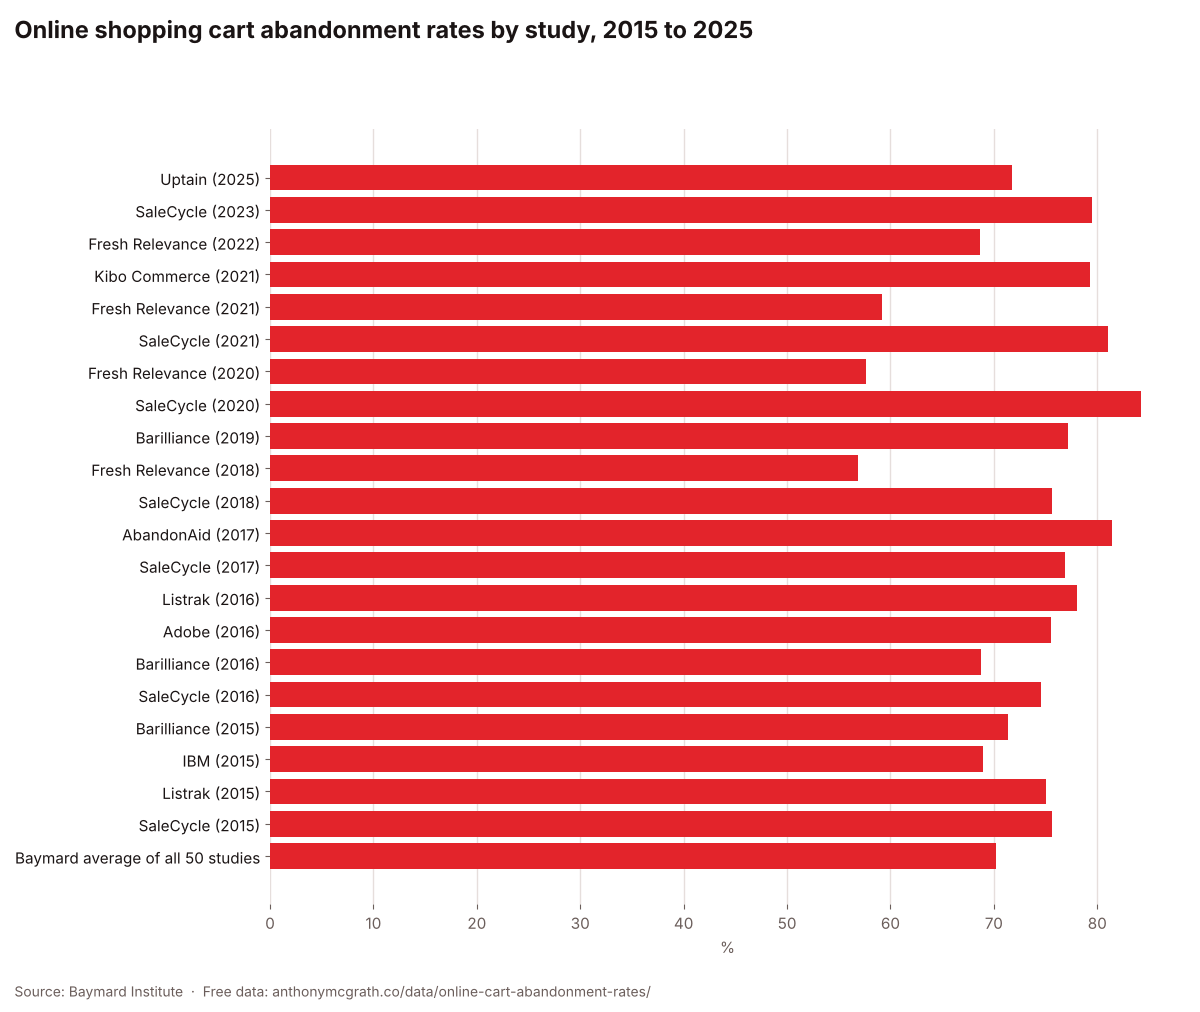
Online shopping cart abandonment rates by study, 2015 to 2025
Baymard Institute's running list of 50 cart abandonment studies puts the average documented rate at 70.22%, meaning roughly seven in ten online baskets are left without a purchase.